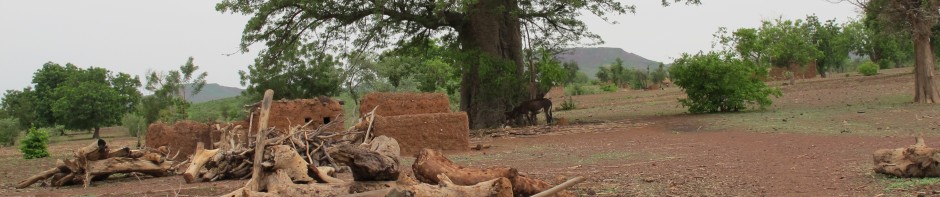
Sahelian Greening: The Sahel of West Africa has historically been synonymous with desertification. Population pressure, over-grazing, and inappropriate agricultural practices are thought to degrade the environment, reduce rainfall, and cause deserts to expand. Recent analyses of satellite imagery, however, suggest just the opposite — they indicate large areas of increased vegetation across the Sahel beyond what one would expect based on rainfall alone. This “greening of the Sahel” is well documented but the mechanisms driving it are poorly understood. With funding from a National Science Foundation (NSF) Cultural Anthropology Scholars Award (BCS-1261800), I have acquired basic skills in remote sensing (RS) to better understand the human role in the greening process to test the possibility that improved land-use practices drive greening in northern Burkina Faso.
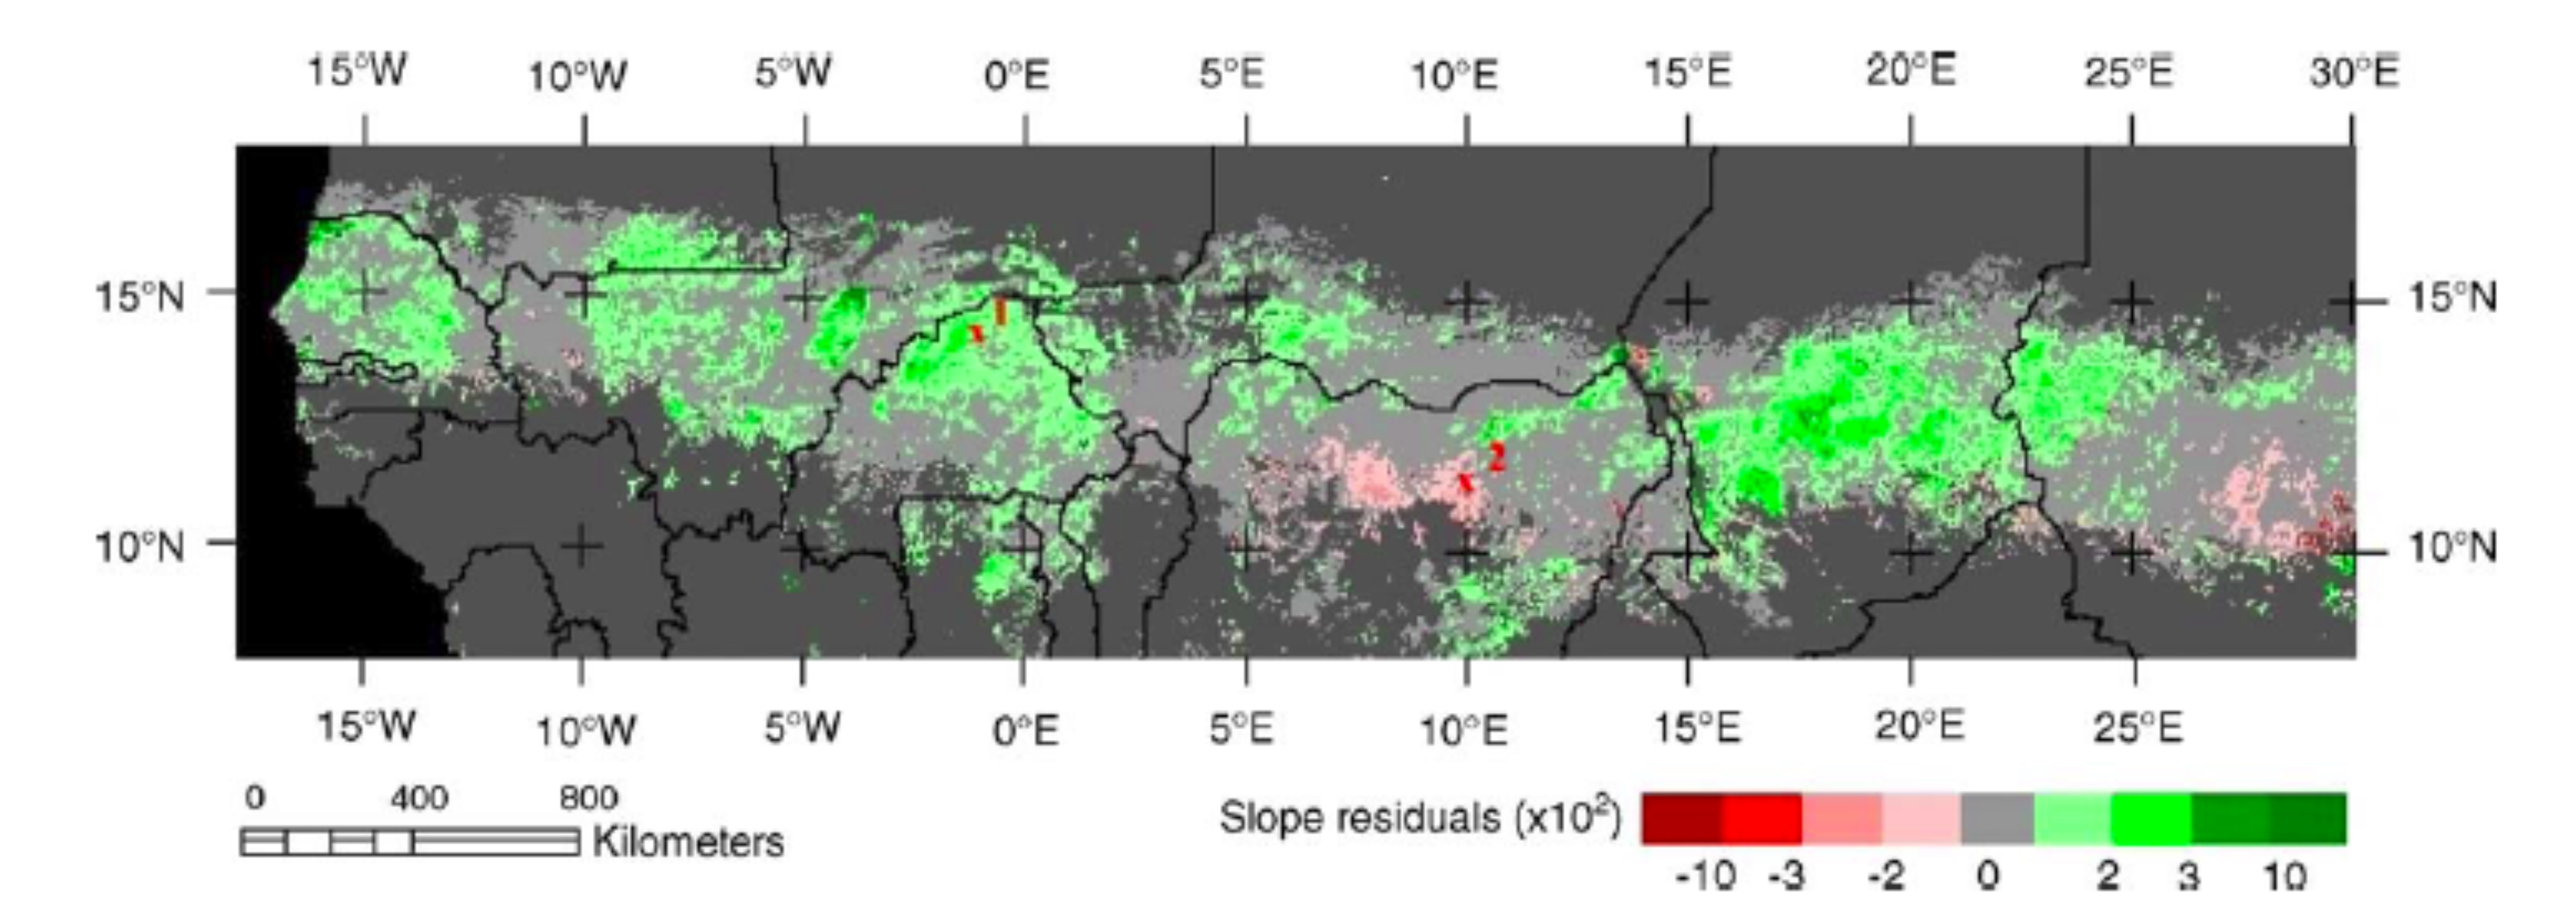
Greening (green) and browning (red) of the West African Sahel – Source: Herrmann, Anyamba and Tucker, 2005
NDVI/RFE Data: Working with my colleague Dr. Aaron Moody (UNC Geography Dept.), we assembled a time series of Normalized Difference Vegetation Index (NDVI) and gridded rainfall (RFE). NDVI is an estimate of green vegetation productivity based on the ratio of the near infrared (NIR) band and red (R) band (NIR-R/NIR + R). We used an NDVI product developed for the Famine Early Warning System (FEWS) derived from the Advanced Very High Resolution Radiometer (AVHRR) missions. The RFE product was also developed for FEWS and consists of estimated rainfall derived from meteorological stations and satellite imagery. Both the NDVI and RFE data have the same spatial resolution (8-km X 8-km) and temporal resolution (10-day). Likewise, the pixels are spatially and temporally coherent. We restricted our data and analysi to just the geographic extent of Burkina Faso.
NDVI/RFE Model: Similar to a method used by Herrman, Anyamba and Tucker (2005), we used a simple linear regression model to predict NDVI for each pixel and each 10-day period. The cumulative 30-day RFE (i.e., 3 10-day periods) was used to model NDVI for the third 10-day period. Next, we calculated the residual (i.e., the difference between the modeled and observed NDVI) for each pixel and each 10-day period. The slope of the residuals for the entire time series was calculated for each pixel.
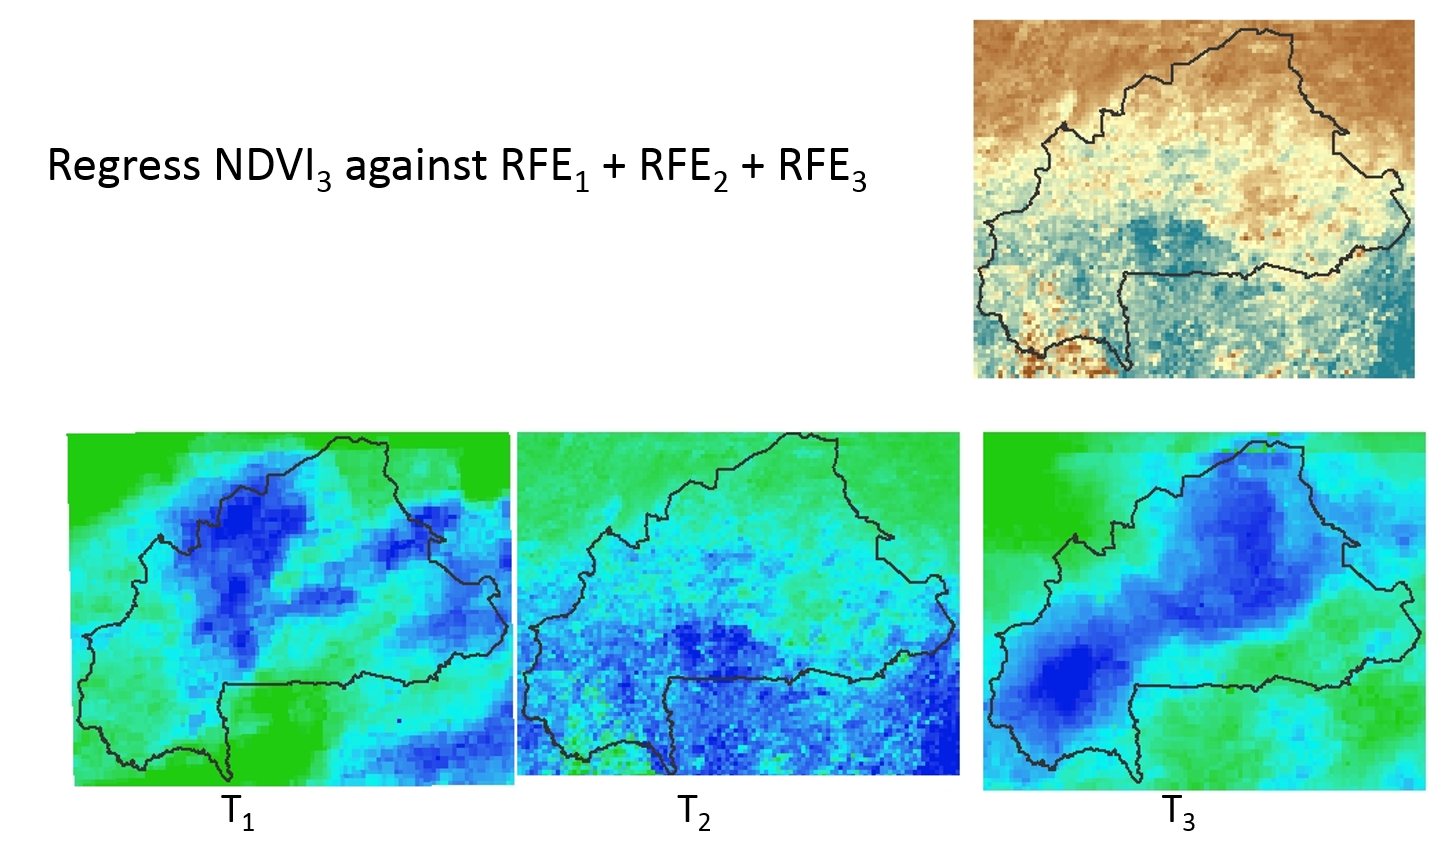
Diagram of NDVI/RFE Regression Model
NDVI/RFE Maps: We mapped the residuals for the entire extent of Burkina Faso for two different time periods. One is the recent short-term time period from 1995 to 2009. The second is for the entire period of record from 1983 to 2009. These results differ from one another.
NDVI-RFE Residuals for Burkina Faso with Department of Kongoussi indicated
Rapid Participatory Rural Appraisal: With a PhD student Lisa Nébié, we conducted preliminary fieldwork to ground-truth these results with stakeholders in Burkina Faso. Using rapid participatory rural appraisal (RPRA) techniques, we showed maps, aerial photos, and Google Earth images to farmers, NGO officials, and government agencies. We sought their feedback and interpretations of the maps and images. Local farmers felt strongly that Kongoussi was greening and that their SWC efforts were increasing soil fertility and vegetation cover. Government agricultural extension agents and forestry officials in Kongoussi, however, expressed concern that SWC improvements were highly localized and that the overall region continues to degrade.
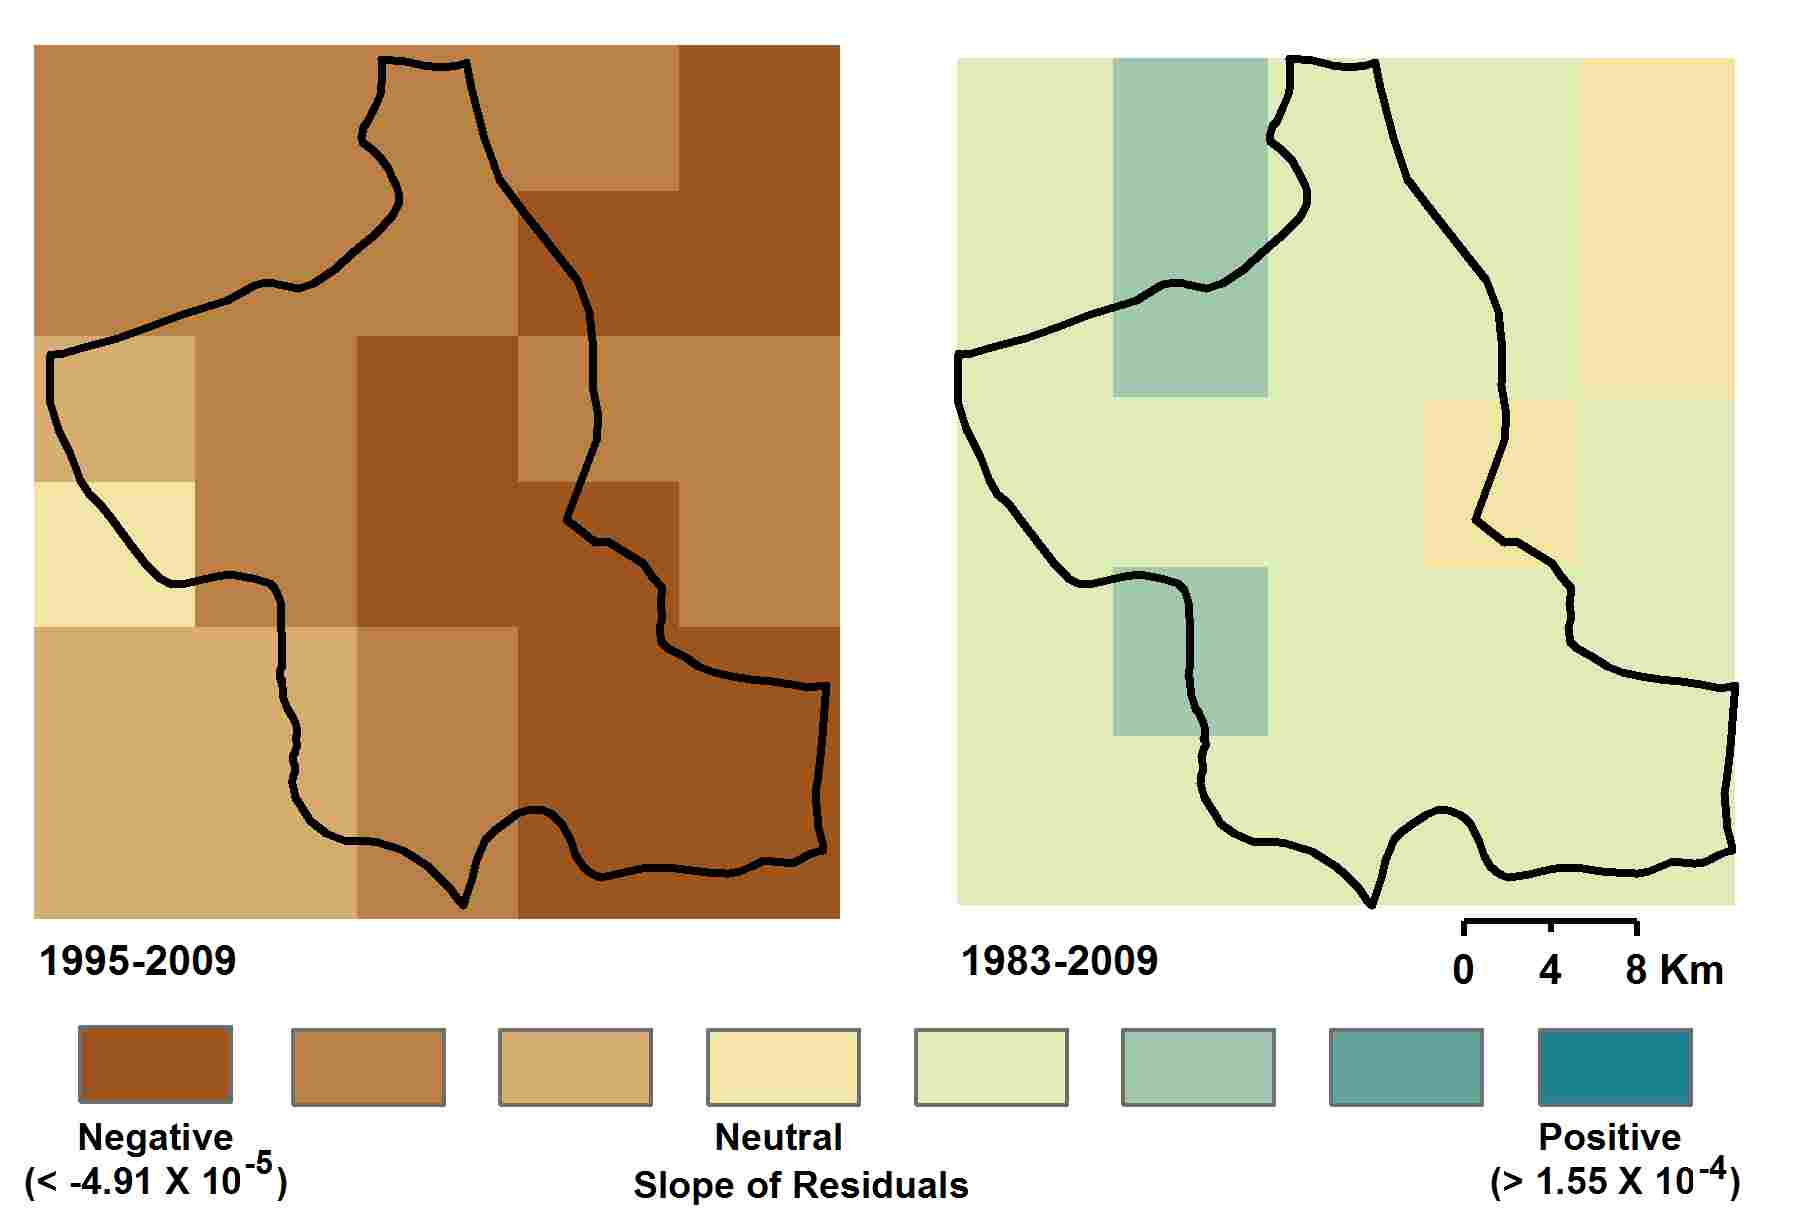
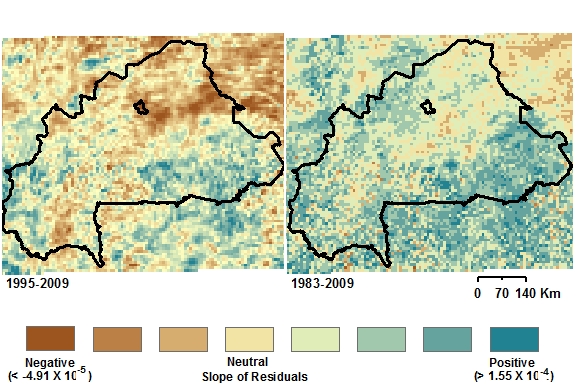
NDVI-RFE Slope of Residuals for the Department of Kongoussi
The maps above suggest that both competing narratives are valid. The slope of NDVI-RFE residuals in the recent short-term (1995 to 2009) are negative, which indicates “browning” or land degradation. On the other hand, NDVI-RFE residuals for the long-term (1983 to 2009) are positive, which indicates greening.
High-Resolution Sattelite Imagery and Aerial Photographs: Through the IGB, we obtained high resolution black-and-white aerial photographs of four select villages from 1992 – when SWC efforts in Kongoussi began. We additionally obtained high-resolution (2-m X 2-m multispectral; 0.5-m X 0.5-m panchromatic) GeoEye-1 and WorldView-2 satellite images for the same four localities. All images and photographs share approximately the same anniversary date (January and March) so that change in land-use and land-cover (LULC) can be directly compared by controlling for phenology and seasonality.
